by Das BrainÂ

In the last post (Part1 ) I wrote about when to get into a stock for long term investing and capital gains and as promised I will write about my experiences in regards to mid-term and intermediate-term market timing in this blog post. I will save the short-term trading information for part 3.
First let’s define mid-term. Mid-term time horizon would be considered 1 to 2 years, this is my personal definition however other traders out there may define it differently. As for intermediate time frame, I define that as holding a stock for 1 month up to a year. For short-term, I will define it in my last post part 3 of “When To Buy A Stock or Option – Market Timing”
If you plan to hold a stock from 1 to 2 years (mid-term), then the timing of when to buy is very similar to the timing of a long-term stock purchase. For mid-term stock play, you should focus and keep a watchful eye on both the stock indexes and the target stock price for opportunities.
1. When stock indexes takes a dive of 3 to 5 percent, check your target stock, and see if the price of the stock has also taken a hit of 3-5 percent. If so, then move in and open a position on the stock, I would recommend after the second or third day from the initial decline. Mind you, sometimes certain stocks don’t react immediately to stock index declines. Some stocks, won’t be affected by the minor correction until a week or even later or maybe not at all.
2a. If you want to be even safer, then wait for your target stock to take a larger hit of 5 to 10 percent or even more. When a large declines like this happens to a solid company’s stock due to over reactions to some news, event, earnings report or major stock market correction then it usually presents a good buying opportunity for mid-term or long-term capital appreciation. This type of event don’t happen as often though.
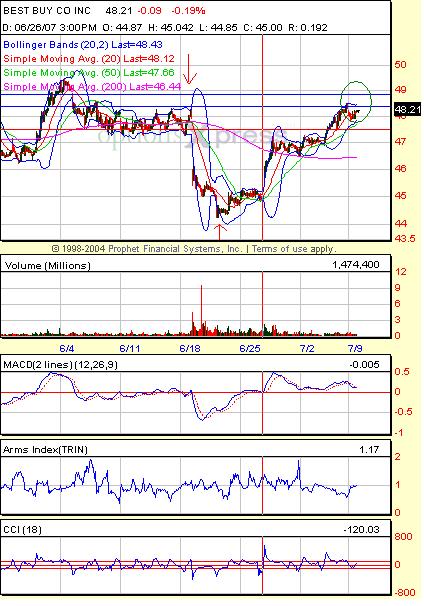
2b. From my own experience I notice that a 3 to 10% decline in a target stock price can and do generally happen when a good company have a bad earnings report. From a market timing perspective this represent a good stock or options purchase opportunity for mid-term or long-term trading. Take a look at Best Buy (BBY) for example. Best Buy’s last earnings report was on June 19 and the earnings reported was not as good as wall street analyst expected so it took a plunge from $48.35 (red arrow) down to a low of around $44.25. That is a decline of 9% in the stock price, a buying opportunity for mid-term or long-term trading. If you look at the Best Buy (BBY) stock chart below you will see that today July 9th (green circle), the stock price is trading at $48.10. If you hold this for 1-2 years time frame for a mid-term trade, you should make a decent return. However, always remember to take some profits off the table, and cut your losses if the stock price ever turns the other direction.

For intermediate stock plays, you can use the same market timing as the two previous time frames (long and mid-term) as outlined in Part 1 and this post point 1, 2a and 2b. Except with intermediate trading you will cash in or sell / close your position in the stock or options anywhere from 1 month of opening your position to 1 year.
Bookmark at:
StumbleUpon | Digg | Del.icio.us | Dzone | Newsvine | Spurl | Simpy | Furl | Reddit | Yahoo! MyWeb


[...] My next post will be Part 2 and I will write about intermediate and mid-term market timing which is very similar in criteria. [...]